
Police used force on 0.14% of calls for service in a peer-reviewed study of nearly 1.5 million Cincinnati police responses. That is roughly 1 to 1.5 calls in every 1,000. The other 99.86% ended without any documented force.
That number should be the starting point of every use-of-force conversation. Force is not the routine outcome of police work. It is a rare event.
Rare is not random, though. The same study shows force clusters in specific kinds of calls and specific kinds of contact. Those patterns line up closely with what the FOCUS System calls amplifiers: the context that raises the immediacy or likelihood of harm.
The study
Joel Miller, Sam Guthrie and Eric Piza published the research in Crime & Delinquency in 2025. They linked Cincinnati Police Department dispatch records to its use-of-force records from October 2014 through July 2021.
The final dataset held 1,499,539 calls for service and 2,410 matched use-of-force incidents. Most earlier research starts after an officer is already face-to-face with a suspect. This study starts earlier, at the call itself, and asks which calls end in force.
The researchers sorted 189 dispatch codes into 18 call types. They also tested response time, officer-initiated contact, call priority, nighttime, high-alcohol periods, officer workload, neighborhood demographics, local crime rates, police district, and year. They checked the results a second way, counting only less-lethal weapons such as TASERs, beanbags, and chemical irritants. The patterns held.
What predicted force, and what didn’t
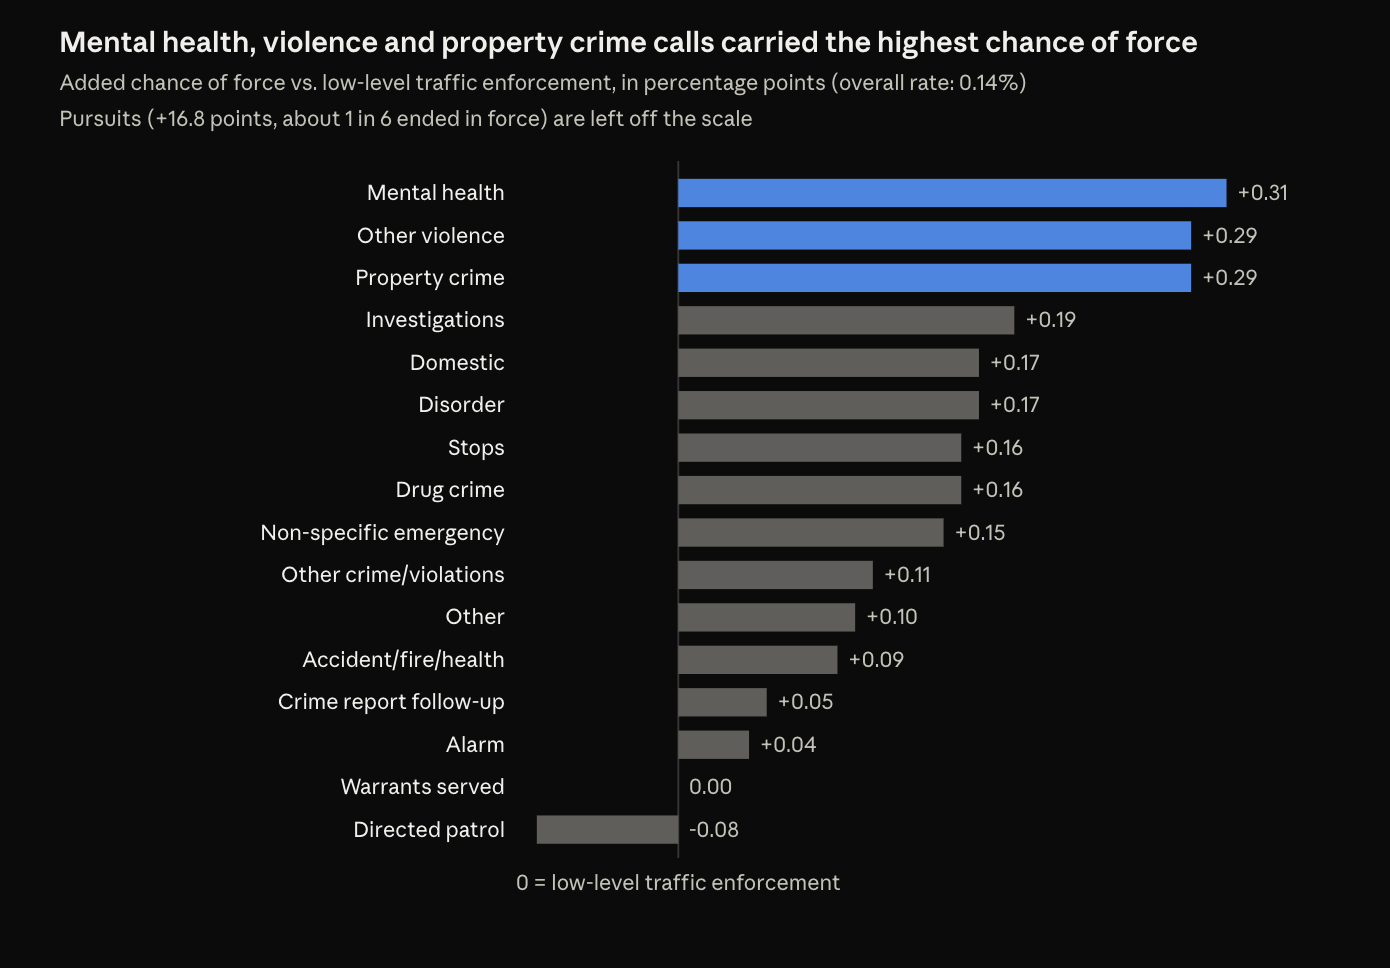
The type of call mattered most. Pursuits stood far above everything else, with force in about 1 in 6. Mental health calls, violence calls, and active property crime calls came next. Domestic calls, stops, and disorder sat in the middle. Warrant service and directed patrol ranked lowest.
How officers made contact mattered too. Calls reached in under five minutes, and officer-initiated contacts, were more likely to end in force than calls answered after 30 minutes or more. That held even after controlling for call priority.
Several factors officers often assume matter did not show up. Nighttime, high-alcohol periods, and officer workload had no measurable link to force. Neighborhood racial makeup, poverty, residential instability, and crime rates had none either. One police district ran lower than the others, which points to leadership and culture. Year-to-year rates stayed flat despite policy revisions.
What this means for FOCUS amplifiers
The study’s strongest predictors are context, not demographics. That is exactly what FOCUS amplifiers capture. An amplifier is context that increases the immediacy or likelihood of harm at the moment of decision.
| FOCUS amplifier | What the Cincinnati data showed | How directly it supports it |
|---|---|---|
| Rapidly evolving sequence | Pursuits ended in force about 1 in 6 times, more than 100 times the overall rate | Strong: flight is the clearest rapidly evolving sequence |
| Immediacy of contact | Contacts under 5 minutes and officer-initiated contacts carried more force than slow responses; active crimes carried far more than completed-crime follow-ups | Strong: same crime types, different immediacy, different outcome |
| Credible weapon information | Violence calls, which include weapons, shootings and robberies, were among the top three | Indirect: the study did not isolate weapon information |
| Context that is not an amplifier | Neighborhood race, poverty, crime rate, time of day and alcohol periods showed no link | Supports scoring what is present at the decision moment, not where or when |
The active-versus-completed comparison is the cleanest lesson. An active property crime call carried about six times the added force risk of a follow-up on a crime already completed. The type of crime did not change much. The immediacy did.
The study also shows why amplifiers alone never justify force. Even mental health calls, the highest non-pursuit category, added only about 0.3 percentage points. Call-level factors explained very little of the overall picture. The call sets the stage; the subject’s behavior decides the outcome. That is why the FOCUS Risk Index stacks observed indicators with amplifiers: FRI = I + A
Pursuits: where the two bodies of research meet
Pursuits produced the study’s most striking number. About 1 in 6 pursuit calls ended in force, more than 100 times the overall rate. Pursuits were also rare, just 0.03% of all calls.
The FOCUS video study points in the same direction from the other side of the encounter. Fleeing preceded 41% of attacks on officers, making it one of the most common sentinel cues. Walking away during active contact preceded another 31%. Cincinnati shows that flight is where force concentrates. FOCUS shows that flight is often what comes right before an attack.
Foot pursuits
The study did include foot pursuits. Its call-type appendix defines pursuits as chasing suspects on foot or in vehicles, mostly officer-initiated. It did not separate the two. The 1-in-6 figure describes foot and vehicle pursuits combined, so it cannot say which carries more force risk.
That split matters for FOCUS. A foot pursuit puts the officer and subject within reach, often alone, in uneven terrain and low light. FOCUS cases show the pattern: a subject flees on foot, appears to give up, then draws and fires. Fleeing with one arm pinned and the hand hidden is treated as a high-consequence combination. Courts have credited it as a cue comparable to a waistband reach (Argueta v. Jaradi, 5th Cir. 2023).
Vehicle pursuits
A vehicle pursuit carries a different danger: the car itself. The Supreme Court has recognized that a high-speed chase can endanger officers and the public enough to justify ending it with force (Scott v. Harris, 2007; Plumhoff v. Rickard, 2014). When the car stops, the encounter can turn into a foot pursuit or a high-risk stop within seconds.
The gap
Because the study combined foot and vehicle pursuits, it leaves three questions open:
- Which kind of pursuit drives the 1-in-6 rate.
- How often a vehicle pursuit turns into a foot pursuit before force is used.
- What the subject did during the pursuit. Call records cannot see a pinned arm, a hand to the waistband or a sudden stop and turn.
That third question is where FOCUS sits. The study tells trainers that pursuits deserve the most attention. FOCUS tells officers what to watch for once the chase is on.
Limits, and what to take into training
This is one city and administrative data. Cincinnati’s records likely undercount proactive work and low-level force. The study measures the call, not the second-by-second encounter, so it cannot see the behavioral cues FOCUS is built on. It supports the amplifier concept; it does not test the FRI itself.
With that in mind, three points carry into training:
- Lead with the 0.14%. Officers, juries, and the public should hear that force is rare before they hear anything else.
- Teach amplifiers as context, not triggers. Immediacy, flight, and violence context raise risk. They do not replace observed indicators.
- Articulate the context. When force is used, the report should name the amplifiers present: an active call, a fast arrival, a pursuit, violence reported by dispatch. The data shows these are exactly where force concentrates.
Reference
Miller, J., Guthrie, S., & Piza, E. L. (2025). Examining use of force outcomes in police calls for service: Evidence from Cincinnati. Crime & Delinquency, 71(12), 3707–3729. Open-access preprint
Summary consulted: Tactical Science, “What Actually Predicts a Use-of-Force Outcome”